Before we start, my Microsoft Sentinel contributions have a new home on GitHub! I will gather all my Sentinel resources in one central repo called DCSecurityOperations. This is a sister project to my DCToolbox repo.
Today I’m happy to announce my new Attack Surface Reduction Dashboard. This dashboard helps you implement the ASR rules of Windows/Defender, and to monitor them over time. The dashboard can filter on rules in Audit mode and Block mode.
Update – November 2022: My ‘Attack Surface Reduction Dashboard’ is now a part of Microsoft Sentinel and can be installed from Workbooks > Templates in your Sentinel workspace.
What You Can See In The Dashboard
Before showing you the data in your tenant, the dashboard will give you an overview of all available ASR rules in Windows, with descriptions and docs links. There are currently (as of 15/6-22) 16 different ASR rules in Windows. You can find their documentation here. The rules reference is followed by some instructions on how to use the dashboard.

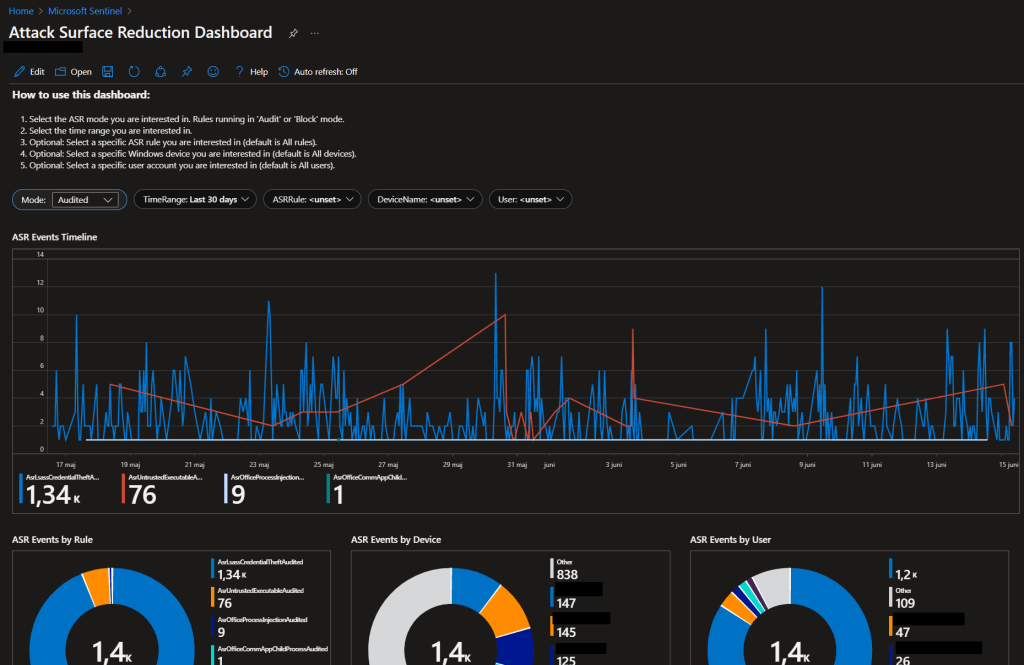
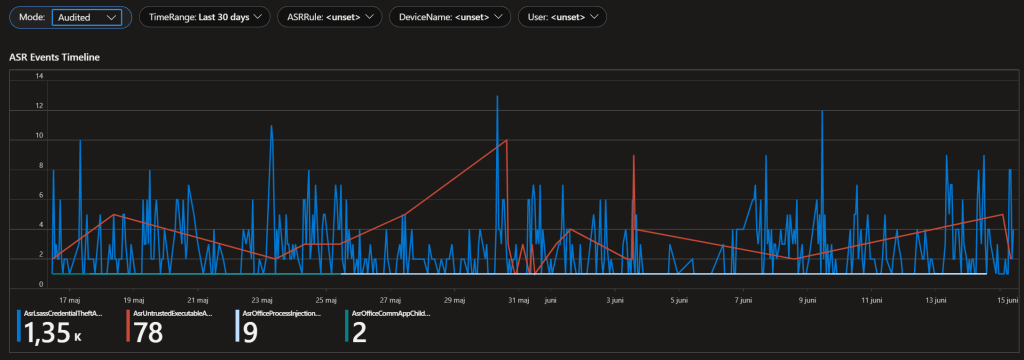
Now it gets interesting. There are some filters you can apply in the dashboard. First you need to decide if you are interested in rules running in audit mode or block mode. Select the time range. After that you can, if you want to, filter on specific rules, devices or users. This is optional. The filters you set will affect all graphs in the dashboard.
The first graph is a timeline of all ASR events in the current time frame. This is great for understanding when problems arise, key indications in a security incident investigation, etc.
You will then see pie charts of the number of ASR events by Rule, Device or User. Finally, at the bottom, you will get a detailed event log where you can dive into specifics about ASR events, like which application triggered it, and what it tried to do. This is incredibly powerful when investigating ASR incidents, or when building exclusion policies during ASR deployment.

Install the Attack Surface Reduction Dashboard in Microsoft Sentinel
First, download (or copy) the latest version (it’s a JSON file) of Attack Surface Reduction Dashboard from my GitHub.
Go to your Microsoft Sentinel workspace and click on Workbooks. Add a new workbook.
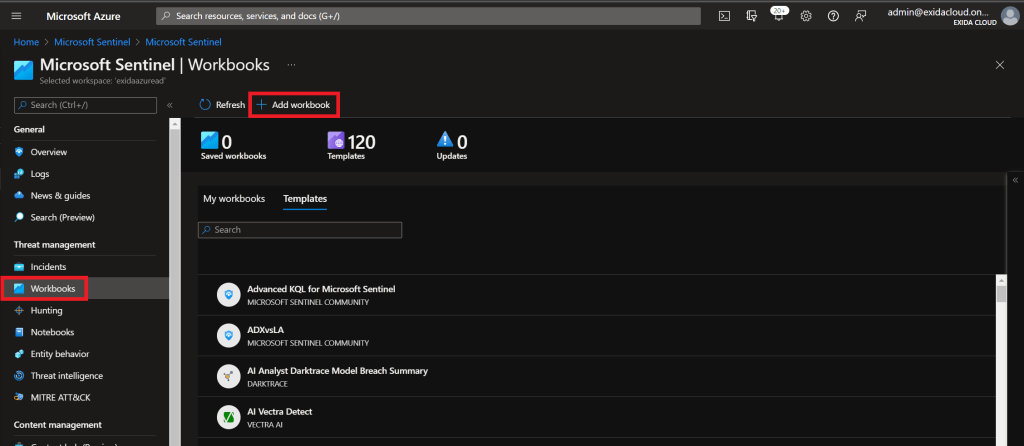
A new workbook will appear based on the default template. Click on Edit and the Advanced Editor button. This will allow you to replace the entire JSON content with the one from my GitHub repo.

Replace the JSON content and click on Apply. The new workbook will now appear and you can start to use it. Easy!

Finally, to permanently save the workbook in Sentinel, click on the save icon at the top and select the same Azure resource group as your Sentinel workspace (or else it won’t show up in Sentinel). Also set the Title to Attack Surface Reduction Dashboard. You’re all set!

Summary
I hope that the Attack Surface Reduction Dashboard can help you understand the ASR rules and their events in your tenant, and prevent bad configuration, security incidents, and ease deployment.
Please follow me here, on LinkedIn, and on Twitter!

Hi,
Im getting “The query returned no results.” We have auditlogs sent to sentinel log space. Is there something else Im missing?
Regards
Rob
Hi Daniel
Thanks for the Dashbord. We don´t use Sentinel fra MS.
You say that we can use a WorkBook instead. I Just get the following error “‘where’ operator: Failed to resolve table or column expression named ‘DeviceEvents’…”
I do have everything exported from Azure AD to a Log Analytics workspace.
AuditLogs
SignInLogs
NonInteractiveUserSignInLogs
ServicePrincipalSignInLogs
ManagedIdentitySignInLogs
ProvisioningLogs
ADFSSignInLogs
RiskyUsers
UserRiskEvents
NetworkAccessTrafficLogs
RiskyServicePrincipals
ServicePrincipalRiskEvents
Do you have any ideas?
Hello Daniel.
I would like to implement this in our LogAnalyticsWorkspace, but I cannot find which connector needed to get these logs, and I cannot find any information regarding this in the blog. Could you please explain?
That looks great, but can you point to which account/resource this dashboard should be pointed at as we have several resources groups, different accounts (different business units/companies), etc.
That looks great, but can you point to which account/resource this dashboard should be pointed at as we have several resources groups, different accounts (different business units/companies), etc.
Hello! After I’ve saved the Workbook I get this error on all screens. What do I miss?
“‘where’ operator: Failed to resolve table or column expression named ‘DeviceEvents'”
Nice workbook! You write that AAD Audit logs is sufficient, but I guess DeviceEvents is what we’re querying here? On average, how much data would you expect to be ingested per device if only ingesting DeviceEvents from MDE?
Great work – just installed it in one of my client’s Sentinel – works a treat. Thank you.
What the prerequisites for this ? does it require MDE P1 or P2, are there any other dependencies?
Make sure you target the correct workspace in the workbook settings.
Yes, the table is part of Defender for Identity. It can be enabled in Microsoft Sentinel Connector but I don’t know how you do it without sentinel.
The Microsoft 365 Defender connector. Make sure you enable DeviceEvents.
You must enable DeviceEvents in the Microsoft 365 Defender connector in Sentinel.
Thanks! Yes, DeviceEvents are required. It’s impossible to say how much data because it depends on the user and the installed applications.
It requires you to have access to raw hunting data in Defender. That is P2 functionality, but ASR is P1, so you have to ask Microsoft 🙂 I use P2.