
I recently released my Conditional Access Sentinel Analytics Rules Pack to help you monitor Conditional Access changes and bad configuration. Alerts will help you notice any configuration changes happening, both accidental and malicious. But then I figured, it would be nice to visualize the queries to better understand the history of recent conditional access changes, so I created a dashboard based on Microsoft Sentinel/Azure Log Analytics workbooks.

What You Can See In The Dashboard
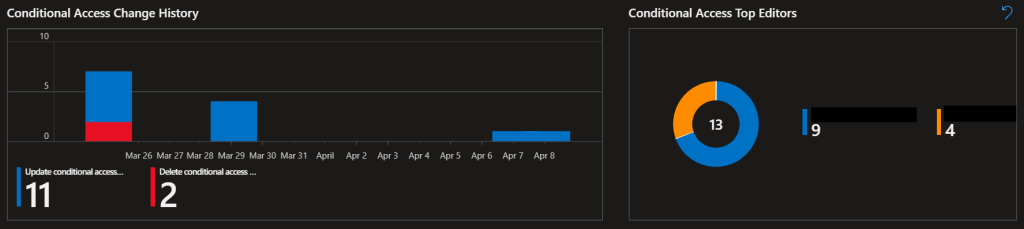
First of all, you can filter the dashboard on a time range that suits you. 30 days is the default setting. The top graphs displays the recent Conditional Access change history in a timeline, and the top editors by number of changes they’ve made. This can be useful to get an understanding of when something happened, and who made it happen.
Below the graphs you can see the complete change log. It shows you at a glance, what policies where changed, when they changed, and by whom. By clicking on a log post you will get a policy comparison at the bottom showing you how the policy looked before the change, and after the change. It contains detailed information and you can find out what policy settings changed, exclusions, applications, in what order things happened, etc.
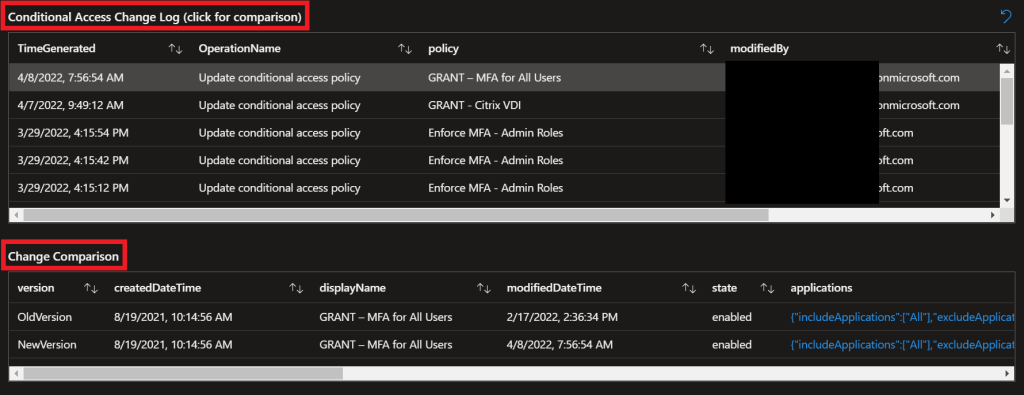
This information can be used in a threat investigation or when troubleshooting Conditional Access or other Azure AD access related issues.
Install the Conditional Access Change Dashboard in Microsoft Sentinel
First, download (or copy) the latest version (it’s a JSON file) of Conditional Access Change Dashboard from my GitHub.
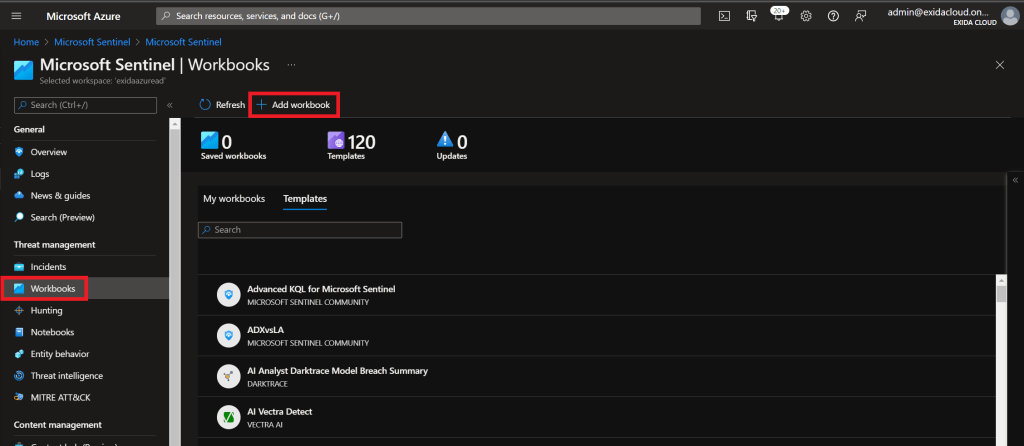
Go to your Microsoft Sentinel workspace and click on Workbooks. Add a new workbook.
A new workbook will appear based on the default template. Click on Edit and the Advanced Editor button. This will allow you to replace the entire JSON content with the one from my GitHub repo.

Replace the JSON content and click on Apply. The new workbook will now appear and you can start to use it. Easy!

Finally, to permanently save the workbook in Sentinel, click on the save icon at the top and select the same Azure resource group as your Sentinel workspace (or else it won’t show up in Sentinel). Also set the Title to Conditional Access Change Dashboard. You’re all set!

Note that you can do this without Microsoft Sentinel as long as you are exporting your Azure AD audit logs to an Azure Log Analytics workspace. Just do the same procedure in Azure AD workbooks instead: https://portal.azure.com/#blade/Microsoft_AAD_IAM/ActiveDirectoryMenuBlade/Workbooks
Summary
I hope that the Conditional Access Change Dashboard can help you understand the Conditional Access changes going on in your tenant, and prevent bad configuration, mistakes, and cyber attacks.
Please follow me here, on LinkedIn, and on Twitter!

Nice!
Nice! thanks for sharing.